![]()

| Introduction | |
| Anisotropy | |
| Definition of velocities e.g. rms, interval, stacking | |
| Velocity Analysis Methods e.g. preconditioning, analysis interval, moveout stretch. | |
| Interactive Velocity Analysis explanation of sample display | |
| Quality Control of Velocity Picks |
![]()
The CMP method, NMO and the concept of stacking velocity was introduced in a previous discussion. For a single flat layer the shape of the moveout curve is defined by the hyperbolic relationship between zero-offset time and velocity. In this section we define several types of velocity commonly used in seismic processing and concentrate on methods used to determine and quality control velocity analysis. Several velocity analysis methods have been used in the past but today most velocities are picked interactively using combination displays on processing workstations. Nevertheless, velocity analysis is still one of the most time consuming parts of seismic processing. It is also probably the most critical stage since the velocity analysis is an initial interpretation of the data and it is important that the seismic interpreter is involved in the analysis and quality control stages. Velocity analysis is often carried out several times during processing resulting in an iterative improvement of velocity estimation. It is generally considered that velocity picking is an art.
The CMP method generally ignores mode conversions and anisotropy (variation of a property with direction of measurement). In horizontally layered media such as shales the transverse anisotropy may cause the velocity to vary as much as 20% depending on dip. Anisotropy is also used to refer to the difference between well velocities (vertical measurements) versus seismic velocities (horizontal measurements). Seismic measurements are typically 5-10% faster.
![]()
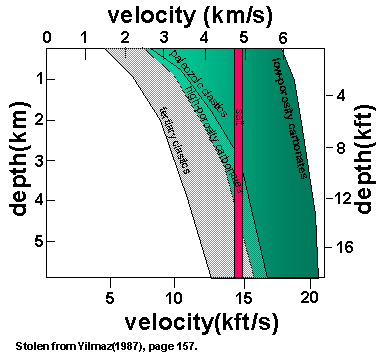
A sonic log measures the velocity variation in depth as seen immediately adjacent to the borehole. A zero-offset VSP or checkshot survey will measure the vertical velocity in the vicinity of the well. Seismic measurements of velocity are averaged over the horizontal distance through which the seismic energy travels. Sediment velocities generally increase with depth due to increased pressure of the overburden. Fluids within pores tend to make the rocks less compressible and lead to higher interval velocities for P-waves. The adjacent figure summarises typical velocities for differing lithologies and porosities. Carbonates in particular show a large range in velocities depending on porosity. Sheriff and Geldart show further diagrams illustrating the typical trends of velocity with various parameters. Generally is its correct to stack the data with seismic velocity but little else. Nevertheless seismic velocity is often used for depth conversion and migration purposes and can be calibrated to well information or used where well information is particularly sparse.
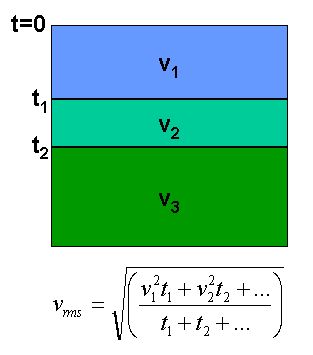
Referring to definitions shown in the adjacent figure:
Is the constant velocity of a single layer (which can be very thin). Vint can be approximately calculated from Vrms using the DIX equation (the inverse of that shown in the figure).
Is the velocity required to best NMO correct the data using the hyperbolic NMO assumption. The difference between Vnmo and Vstack is subtle.
For multiple flat layers and assuming the offset is small compared with the depth, a hyperbolic moveout equation can be derived as a truncated power series in which Vrms is used as velocity. The root-mean-square (RMS) velocity is calculated from interval velocities as shown in the figure. At large offsets more accurate NMO corrections can be performed by retaining the next term of the equation - this is usually referred to by contractors as fourth order or higher order NMO correction. For many targets this can become important at offsets greater than around 3km.
Is the velocity required to best stack the data using the best-fit hyperbola over the available offset range. The choice of Vstack can be rather subjective. However, it turns out that an appropriate choice can cover up for a multitude of assumptions made in the CMP stacking process. For horizontal layers and small offsets Vstack should equal Vrms. For dipping layers a higher velocity is required since Vstack = Vrms/cos(dip). Note this assumes no 3D effects. The application of DMO mostly removes the effects of dip from Vstack such that Vstack approximates Vrms and interval velocities computed from the DIX equation should be stable.
Is the depth divided by the two way time to any interface. Vavg is often used for depth conversion but is only valid where the velocity varies only vertically. For significant structures ray-based depth conversion should be used.
Is the velocity required to best migrate the seismic data and is related to the true interval velocity, not the stacking velocity.
![]()
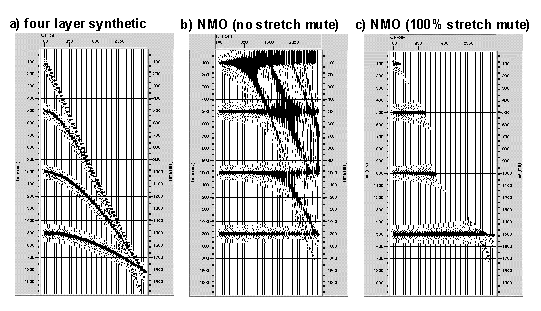
The adjacent figure (a) shows a synthetic with four events. As can be seen from the figure (a) (and also the NMO equation) the magnitude of moveout decreases at increasing time and with increasing velocity. This reduces resolution of velocity in the deeper section. The moveout of the deeper event is increased by recording further offsets. However at offsets longer than 3km in a layered earth the hyperbolic assumption is less valid so the actual velocities picked may be in some error by using the far-offset information. Figure (b) shows the synthetic after NMO correction using the correct velocity. A loss of temporal resolution and frequency content is seen on the far offsets and shallow times - this is called moveout stretch and occurs because the far offsets are shifted more then the near offsets. An interpolator is used in practise to attempt to minimise stretch and maintain resolution and recently contractors have been refining the accuracy with which this is performed. However at some stage the stretched data should be muted out. Figure (c) shows the results of muting using an automatic stretch algorithm available within Promax. In this example the wavelet has been allowed to stretch by 100% before muting occurs. The far offsets show marginal loss of resolution but this is unlikely to affect the quality of the stack trace.
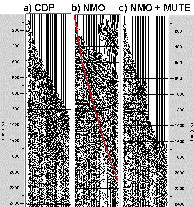
The requirement for muting is not usually too much of a problem since the far offsets and shallow times contain direct arrival, refracted and mode-converted energy which should also be muted out. This is illustrated for real data on the adjacent figure (click here for an enlarged version). Figure (a) shows the CDP before moveout correction, figure (b) shows the data following NMO and with the appropriate (picked) mute shown. Figure (c) shows the gather after NMO with the default 20% stretch mute - an automatic feature designed to remove the effects of stretch. Note that in some cases the automatic mute may remove real data and it may be better to pick a mute by hand to avoid removing too many far offsets. For data with high signal-to-noise ratio a harsh mute may be tolerated but for poor SNR fold may be more important. Any AVO effects may also be present on far-offset traces and should be preserved. As ever the choice will lie with the processor and interpretation geophysicist.
Note that NMO stretch limits available fold in the shallower section and particularly limits the resolution of the seabed reflection. For a seabed around 200ms deep the near-trace offset must be within 100m to ensure a seabed reflection is recorded uncontaminated by the refraction. For 3D acquisition this can present a problem since near offsets may be in excess of 300m for particular source-receiver combinations.
Data must be appropriately pre-processed prior to velocity analysis. The processing to be applied will depend on the purpose of the analysis since velocities will be picked at several stages during a processing sequence. For the first pass of velocity analysis the data will usually have been deconvolved, sorted to CMP gathers and muted. Subsequent passes may require application of multiple suppression, DMO or prestack migration prior to the velocity analysis. Depending on the processing system being used the entire data may be supplied to the velocity analysis routine or more usually the data is edited to a subset which defines the velocity analysis locations. The data may also be bandpass filtered and scaled to reduce noise prior to velocity analysis computations. Severe noise contamination may be removed by dip-filtering. In areas where velocity analysis is particularly difficult sometimes harsher procedures may be used to prepare data for velocity analysis than would be tolerated in production processing.
Velocities are usually picked at discrete spatial intervals along a seismic section and the velocity field linearly interpolated between analysis points. The spatial and temporal sampling interval will depend on the degree of lateral velocity variation and should be sufficient to define the structures under consideration. In theory extra analysis points can be used at any point to more accurately define a particularly complex geological structure. In practise this option is rarely pursued although some contractors now use automatic picking routines to attempt to in-fill velocities from hand-picked seed points. The reliability of these methods depends on the constraints employed within the picking algorithm. For the first pass of velocity analysis a coarse interval of 1000m or 2000m will be chosen. For a typical 20km 2D section, 12.5m CMP interval this will result in 20 to 40 analysis points. For a typical 200km2 3D a 1km interval will result in around 200 analysis points. For a final pass of post-DMO velocity analysis a typical interval would be 500m. At each analysis location the interpreter would typically pick 10 time-velocity pairs or knees required to stack the main reflection events.
Modern velocity analysis is almost exclusively based on the hyperbolic assumption derived for a flat multi-layered earth.
There are several methods of stacking velocity analysis. The preferred method depends on the data under consideration and the preferences of the velocity picker. Almost all velocity analysis today is performed interactively on a screen using a combination display configured according to user preference. Animated displays are common and show the results of applying the NMO and stacking the data with the velocities chosen. In the past velocity analysis was considered to be a computer intensive process and some shortcuts were taken (such as reducing the fold of gathers). The power of modern computer systems means that short cuts are no longer required. Some systems will calculate the velocity analysis on the fly as requested by the user but most systems expect the pre-computation of the velocity analysis displays. The subsequent speed of analysis is limited only by the speed of the picker and the graphics hardware being used. On some displays the interpreter can pick several key horizons which the velocity interpreter can use as main velocity boundaries. Depending on the geological province this method is critical, for example if velocities are to be picked for depth migration purposes. When picking horizons care should be taken to ensure the velocity interpolation stage can handle pinchouts and other more complex geological structures.
CONSTANT VELOCITY STACKS (CVS): In this approach around 10 (or more) adjacent CMPS are selected around each location point. The CMPS are NMO corrected and stacked using a defined range of constant velocities e.g. 1500 to 5000m/s with an interval of around 200m/s. The mini-stack panels are displayed next to each other and velocities picked where key events show the highest amplitude or greatest continuity. The method shows what the data will look like if stacked with the chosen velocity but has a resolution limited to the velocity interval chosen. This may be the best method for data with very poor SNR. Some attention should also be paid to the mutes applied for CVS analysis, particularly if multiples are present.
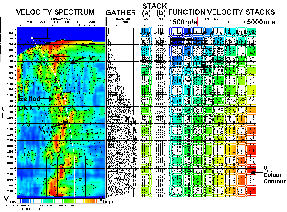
The following displays are available by default on the PROMAX interactive velocity analysis system (see adjacent figure or click here for enlarged figure).
FUNCTION VELOCITY STACKS (FVS): Are a common form of display in which the range of velocities used for the stack panels is defined by percentage variations from a single (best choice) function. The individual panels show high resolution but the quality of the panels depends on the accuracy of the initial function used. A combination display would usually show the central gather NMO of the panels corrected using the range of function velocities. The PROMAX display shows the NMO corrected gather in the centre of the display with function velocity stacks to the far right. The gather and stack displays are interactively updated as picks are made. Stack display (a) is the stack with the currently picked velocity function, stack (b) provides an animate display of the original FVS stacks as the picks are altered. The colour background display reflects interval velocity.
VELOCITY SPECTRUM: The velocity spectrum display (shown on the left of the PROMAX screen) is calculated by determining how well a given hyperbolic event matches real events on the central CMP gather. In the example shown the coherence for a range of trial hyperbolas for velocities 1500-5000m/s every 70m/s is computed at 20ms intervals. These represent far more velocity trials than can be performed using CVS or FVS analysis. The maximum amplitude of coherence is expected where the hyperbola best fits a given high amplitude seismic event. The measure of coherence most often used is called semblance which is robust to noise, spatial aliasing and lateral variations in amplitude. There are various methods of displaying semblance but almost always on modern systems a colour contour display is used with blue representing low semblance and red representing high semblance areas. The axes of the display are velocity (horizontal) and zero-offset time (vertical). The semblance would usually be calculated for the central gather of a group of 10 (sometimes called a supergather), but sometimes an average of say three adjacent gathers is used in order to reduce noise. Averaging too many gathers would increase computation time and may start to filter out geological variations. The velocity interpreter would make picks either on the semblance clouds or on the stack displays. An edited pick is shown on the example display. Broader peaks in the deeper part of the section indicate reduced resolution and offset. The velocity spectrum is also good for identification of multiple reflections.
HORIZON VELOCITY ANALYSIS: Most processing systems allow the computation of velocities at every CMP gather along a given horizon. This method can be quite accurate, but is time consuming and now rarely used. It is common however for the position of interpreted horizons to be overlain on the velocity display. PROMAX allows this feature.
![]()
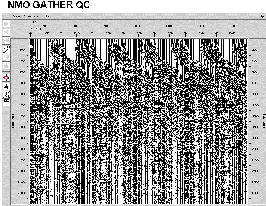
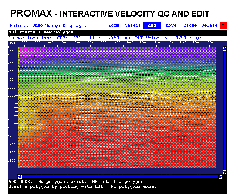
To a certain extent the modern velocity analysis displays can save a great deal of time because quality control can be carried out simultaneously with velocity picking. Usually the processing contractor will make the velocity picks which are then checked for accuracy by the oil company representative. The interpreter should provide as much prior information as possible known to the velocity interpreter such as known problems, known velocity trends from previous work, main horizons etc. The following aids to velocity quality control are provided by the PROMAX interactive velocity display tool.
![]()