
In this section we introduce the concepts of seismic acquisition, starting with a simple ray-based concept and ending with more practical details of the typical systems in use today. The contents of this chapter are fundamental to seismic processing.
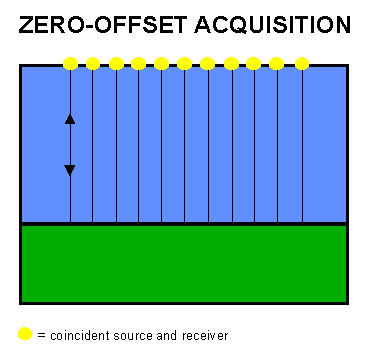
The simplest type of acquisition would be to use a single coincident source and receiver pair and profile the earth along a line as shown in the adjacent figure. Such an experiment would be called a zero-offset experiment because there is no offset distance between source and receiver (both marked as a yellow dot on the figure). The resulting seismic data will be single-fold because there will only be a single trace per sub-surface position. The zero-offset concept is an important one and the method might be used in practise if noise could be ignored. In order to overcome the noise problem and additionally to estimate earth velocity, the method of acquisition most commonly used is the Common-Mid-Point (CMP) method. The same method is also called Common-Depth-Point (CDP). Neither of the two names exactly describes the method, so while both are equally invalid, CMP is usually preferred.
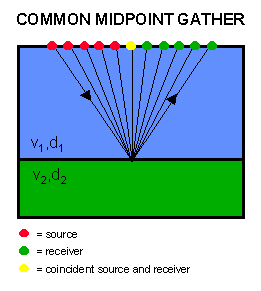
The general idea of the method is to acquire a series of traces (gather) which reflect from the same common subsurface mid-point. In the adjacent figure source points are shown in red and receiver points in green. The traces are then summed (stacked) so that superior signal-to-noise ratio to that of the single-fold stack results. The fold of the stack is determined by the number of traces in the CMP gather.
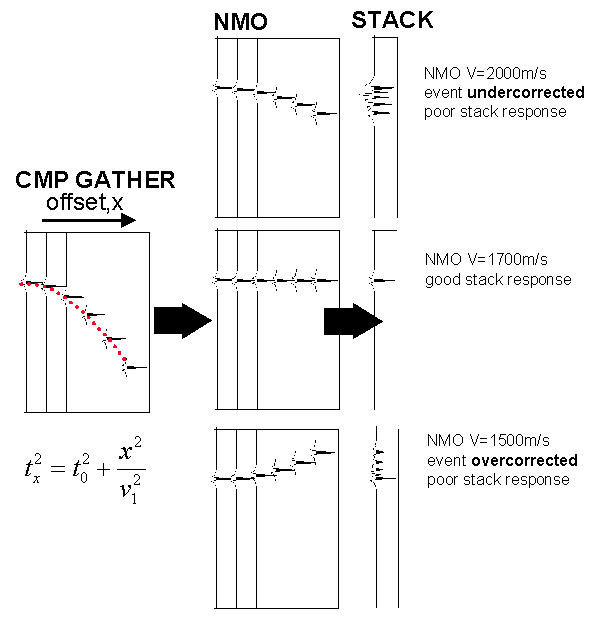
The earlier figure showed rays and the previous figure shows traces resulting from a single six-fold CMP gather depicting reflections from a single flat interface (these could be from any of the subsurface locations from the zero-offset figure). The reflection from the flat interface produces a curved series of arrivals on the seismic traces since it takes longer to travel to the far offsets than the near offsets. This hyperbolic curve (shown in the dotted red line) is called the Normal Moveout curve or NMO and is related to travel time, offset and velocity of the medium as shown by the equation in the figure. Before stacking the NMO curve must be corrected such that the seismic event lines up on the gather. This is called Normal Moveout Correction and the results are shown in the central portion of the figure. The moveout corrected traces are then stacked, to produce the 6-fold stack trace, which simulates the zero-offset response but with increased signal-to-noise ratio.
The CMP gather provides information about seismic velocity of propagation since this is the only unknown variable in the NMO equation. If the velocity applied is too low, the NMO curve will be overcorrected and if the velocity is too high the curve will be undercorrected. Both under and overcorrection result in a smeared stack which would be inferior to the perfect zero-offset trace.
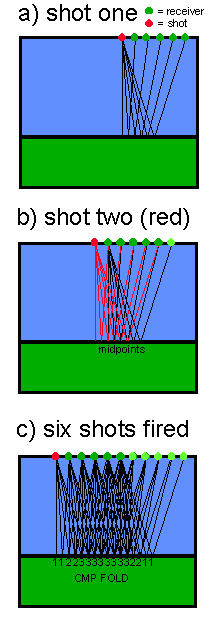
While a CMP could be acquired using a single pair of source and receiver pair this would be very expensive and time consuming way to acquire several lines or a 3D cube of CMP gathers. In practise CMP acquisition is accomplished by firing the source into many receivers simultaneously as shown in adjacent figure (a) which depicts a shot gather where a single shot (red) is fired into six receivers (green). A receiver is also co-located with the shot to produce a zero-offset trace. By moving the source position an appropriate multiple of the receiver spacing CMP gathers can be constructed by re-ordering the shot traces (this process is called sorting). Figure (b) shows the original shot and second shot (traces in red). In this case, the shot has moved up a distance equal to the receiver spacing. The CMP spacing is equal to half the receiver spacing. Figure 3c shows how the fold of the CMP gathers is starting to build up after six shots have been fired. At the beginning of the line the fold builds up to it's maximum of three. The fold stays at the maximum until the end of the line is reached where the fold decreases.
Questions:
1. What happens to the CMP spacing if the receiver spacing is doubled ?
2. What happens to the fold if the receiver spacing is doubled ?
3. What happens to the fold if the shot spacing is halved ?
4. What happens to the fold if the shot spacing is doubled ?
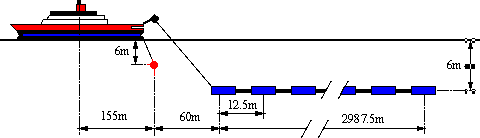
Typically the boat will travel around 4 knots (8 km/h) and the shotpoint interval would be double the receiver group interval. A speed of 4 knots is approximately 2m/s which means approximately 12s between shots for a 25m shotpoint interval. During this time the compressors need to be able to recharge the airgun array before firing again. If the boat travels too fast then the desired record length may not be acquired, too slow and control of the streamer equipment control may be lost. A compromise is required depending on the geological target and sea conditions.
As long as the shotpoint and receiver intervals are integer multiples of each other the CMP fold can be calculated by dividing half the cable length by the shotpoint interval. Non-integer increments can result in some strange geometries such as variable CMP spacing and fold. The following table summarises typical geometries. The fold calculation assumes a 3km cable and all units are in meters. Note that the table refers to the fold and spacing as acquired in the field. These parameters can, and often are, changed during the seismic processing flow. The maximum recording time is that practically established on modern vessels.
|
RECEIVER SPACING |
CMP SPACING |
FOLD |
MAXIMUM RECORDING |
|
|
18.75 |
12.5 |
6.25 |
80 |
4.5s |
|
25 |
12.5 |
6.25 |
60 |
8s |
|
25 |
25 |
12.5 |
60 |
8s |
|
50 |
25 |
12.5 |
30 |
20s |
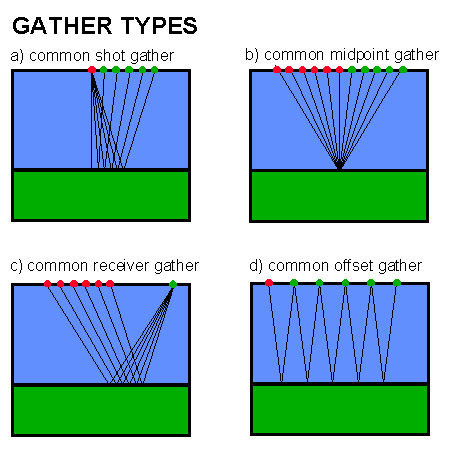
The adjacent figure shows ray-paths for various types of gather which can be constructed by sorting traces from the CMP acquisition technique. Data sorting changes the domain of the data for example from CMP domain to common-offset domain. Each trace will be assigned a series of identifiers during acquisition which will be used to sort the data. These identifiers or trace headers will include things like shot number, receiver number, trace number within shot and source-receiver offset. During processing the data may be sorted many ways using these headers - usually in order to find a domain where noise is separated from signal so it can be suppressed. Whatever the processing sequence, the sort from shot to CMP gather must always be applied before stacking.
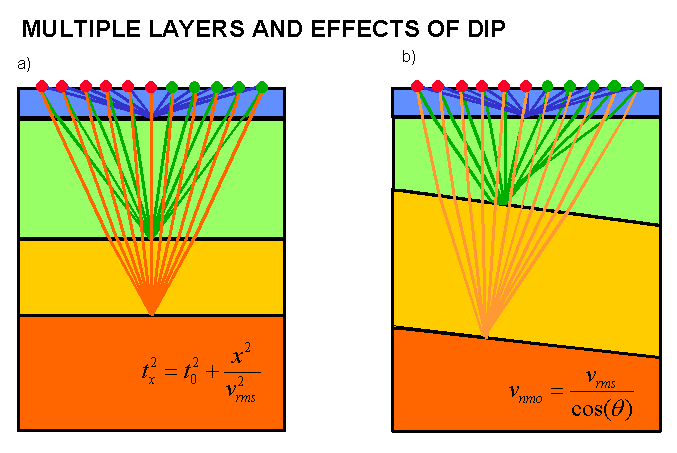
The previous figures and discussion have assumed that the reflecting strata are horizontal. Unfortunately the introduction of dip introduces many complications as shown above. Figure (a) shows six-fold ray-paths for a horizontal three reflector case and in (b) a case in which moderate dip is involved. The CMP method holds for multiple layers and the data can be moved out and stacked to produce three reflections. Note that refraction occurs at the velocity boundaries and velocity increases in each layer. Where dip is present it is clear that the CMP method is breaking down since the traces do not all reflect from the same mid-point location. Processing techniques such as DMO and Migration are required to accurately process CMP data acquired from dipping strata. For further discussion on velocity analysis for multi-layered or dipping data click here.
Practical limitations limit the effectiveness with which we can acquire marine seismic data. For example the modern sleeve airgun source does not produce an exact impulse but is tuned to produce a broadband spectrum in the typical seismic frequencies 5-100Hz.
The adjacent figure shows details of a typical acquisition system (either 2D or 3D) in cross section mode. A number of points are noted with particular reference to seismic processing.
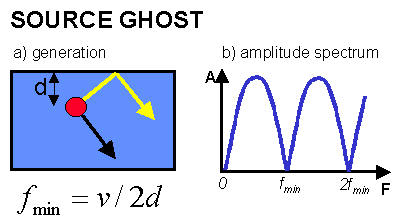 and depth from the back of the ship. Several arrays of airguns of different volumes are tuned to obtain as impulse a source as possible. The source signal is affected by source ghost reflections from the sea surface which destructively interfere with the signal at certain frequencies depending on the source depth (see adjacent figure). The calculation
assumes raypaths are vertical and that the sea-surface reflection is -1. For a source depth of 7.5m frequencies of 0, 100Hz and 200Hz would be completely cancelled.
and depth from the back of the ship. Several arrays of airguns of different volumes are tuned to obtain as impulse a source as possible. The source signal is affected by source ghost reflections from the sea surface which destructively interfere with the signal at certain frequencies depending on the source depth (see adjacent figure). The calculation
assumes raypaths are vertical and that the sea-surface reflection is -1. For a source depth of 7.5m frequencies of 0, 100Hz and 200Hz would be completely cancelled.
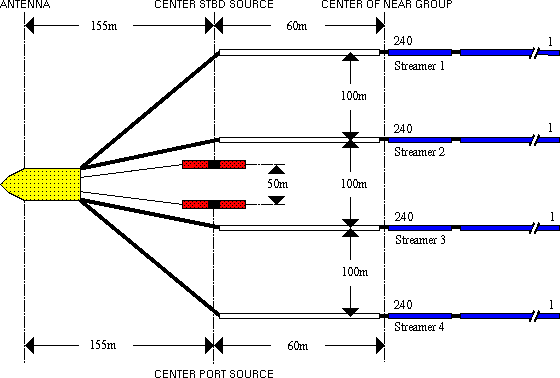
The following figure shows the acquisition system in plan view for a typical 3D vessel with two sources and four streamers. In this mode eight subsurface CMP lines are acquired simultaneously. A 2D vessel would use a single source and streamer towed behind each other to acquire a single subsurface line. It is noted that the reality of acquisition is much more complicated than these diagrams indicate. The diagrams show details of what is required for seismic processing.
The recording and acquisition details for each line within a survey are described in the observers reports or logs. These usually paper (but increasingly digital) reports are critical to the processing of seismic data. Unfortunately they are often lost and are sometimes misleading and incorrect. However they are records made in the field and may be the only place where deviations from the acquisition specifications, such as missed shots, bad traces, noise files, changes in near-trace offset, level of interference etc are recorded. It is difficult (but not impossible) to process seismic data from field tapes without the observers logs.
A modern seismic acquisition system uses several navigation systems firstly to determine and control the position of the vessel in the water and secondly to determine the position of the seismic equipment trailing the vessel. Modern systems almost exclusively rely on GPS (global positioning system) for the majority of positioning. Small receivers mounted on the vessel, tailbuoys and gun-floats can detect signals almost anywhere in the world from 3 or more satellites and determine position within 10m via triangulation. Acoustic systems or pingers are also used in 3D vessels on the source system. Some 3D vessels additionally use laser positioning on the source and tailbuoys. A vast amount of navigation data can be collected onboard a modern multi-streamer seismic vessel. The navigation data requires onboard processing and checking to ensure that all the measurements agree within error. This navigation data should be provided along with the seismic data for data processing purposes where the seismic and navigation information are merged. This is especially important for 3D processing. Following navigation merge the seismic trace headers contain the (x,y) positions of the source and receiver for that trace.
As compresses air is expelled from the gun chamber it expands in the water to form a bubble (rarefraction) which then collapses (compression). An initial impulse is followed by the oscillitory bubble pulse. The Society of Exploration Geophysicists (SEG) ambiguously defines polarity for seismic data recording, that a rarefaction is a positive number and a compression a negative number on tape. An increase in acoustic impedance or positive reflection coefficient is also represented by a trough i.e. a negative number on tape. Once the data is recorded it can be displayed at any polarity. Data is usually recorded at SEG standard polarity.
In the marine case the seismic reflections are recorded by hydrophones (which detect pressure or acceleration changes) and in the land or ocean-bottom seismic case by geophones (which detect motion or velocity changes). There is a 90 degree phase change between the two systems. The signal is usually recorded by analogue instruments and must be digitised to be stored on computer tape. The process of digitising involves forming a time series of the analogue signal by sampling it at a regular interval. A typical trace or record length for exploration seismology would be 6 seconds although for deep crustal work 15 to 20 seconds is common. Water-bottom acquisition systems often combine geophone and hydrophone measurements.
The use of digital computer technology means that the analogue signal must be sampled at regular intervals in time in order to be processed. On older systems this sampling was carried out at the recording system. On modern digital systems the sampling is carried out within the streamer itself. Any signal would be perfectly represented in the computer if an infinite number of samples were taken.
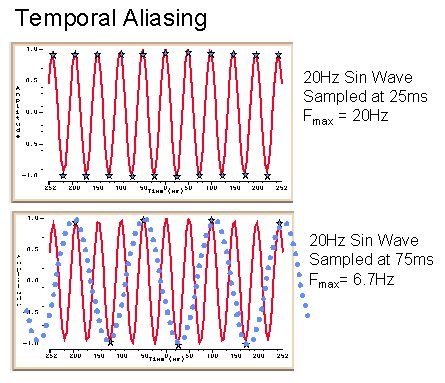
The adjacent figure shows a signal sampled at two different intervals. The top slide shows that a good representation of the 20Hz signal can be made by samples taken every 25ms (marked by the blue stars). In the bottom slide samples are taken every 75ms. An insufficient number of samples are taken and the higher frequency information is "lost" or aliased. The original 20Hz red curve appears as a 6.7Hz blue dotted curve.
The highest frequency f which can be sampled by inteval d is 1/2d - this is called the Nyquist Frequency. Higher frequencies than this are said to be temporally aliased because they will appear as if they are lower frequencies. Typical sampling intervals are 1, 2, 4, 8 milliseconds with aliasing occurring above 500,250,125,62.5 Hz respectively. If data are sampled at an interval of 4ms then a frequency of 150Hz would appear as if it were 100Hz i.e. it would corrupt the true 100Hz signal. Before the data are sampled the higher frequencies which would be aliased by the chosen sampling interval must be removed by an analogue filter in the recording system.
Sampling is equally as important in space as it is in time and is discussed in more detail here.
If either temporally or spatially aliased data are admitted into further processing stages then artifacts and noise may well be introduced which could potentially be misleading. An understanding of sampling (particularly spatial sampling) is an important part of survey design and can affect survey costs and quality. It is obviously important to sample signal correctly, but it is equally vital to adequately sample noise if this is to be removed by processing routines.
Several tape formats defined by the SEG are currently in use. These standards are often treated quite liberally, especially where 3D data is concerned. Most contractors also process data using their own internal formats which are generally more efficient than the SEG standards.
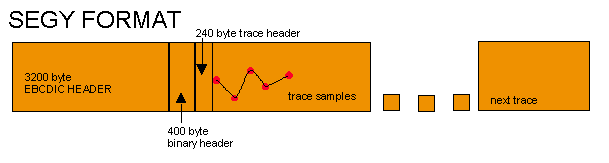
The two commonest formats are SEG-D (for field data) and SEG-Y for final or intermediate products. The previous figure shows the typical way in which a seismic trace is stored on tape for SEG-Y format. The use of headers is particularly important since these headers are used in seismic processing to manipulate the seismic data. Older multiplexed formats (data acquired in channel order) such as SEG-B would typically be demultiplexed (in shot order) and transcribed to SEG-Y before processing. In SEG-Y format a 3200 byte EBCDIC (Extended Binary Coded Decimal Interchange Code) "text" header arranged as forty 80 character images is followed by a 400 byte binary header which contains general information about the data such as number of samples per trace. This is followed by the 240 byte trace header (which contains important information related to the trace such as shotpoint number, trace number) and the trace data itself stored as IBM floating point numbers in 32 byte format. The trace, or a series of traces such as a shot gather, will be terminated by an EOF (End of File) marker. The tape is terminated by an EOM (End of Media) marker. Several lines may be concatenated on tape separated by two EOF markers (double end of file). Separate lines should have their own EBCIDC headers, although this may be stripped out (particularly for 3D archives) for efficiency. Each trace must have it's own 240 byte trace header. Note there are considerable variations in the details of the SEG-Y format. The AHC Houston documentation provides more details.
Modern acquisition vessels can quality control and process 2D and 3D seismic data onboard depending on the size of computer system and number of operators installed. A PROMAX system (or equivalent) and operator are usually provided to QC the seismic data as it is acquired. Quality control would typically included shot displays, FK analysis and brute stack displays. Full onboard processing is possible if required and provides the ultimate QC tool - at a cost. Onboard processing is the fastest way to process data and works well in some areas but should generally be avoided as a mechanism for providing a final data since there is too much to go wrong.
The secret of successful onboard processing is to do your homework in advance and to know the processing sequence ahead of time. Usually the contractor is given examples of existing velocity fields, sections and data at least a month in advance of the survey. The contractor will then start to form a sequence on their system and start to resource the hardware required - ideally involving the people onboard who will be doing the work. Source signatures and other obvious things are often a sticking point at the last minute. The velocity fields are critical if moveout based demultiple is to be attempted onboard.
Pre-processing onboard (e.g. designature, temporal/spatial trace reduction, navigation merge, trace edit/QC) and regular helicopter drops can often achieve a similar turnaround, can cost less and produce better quality than full onboard processing. Sometimes for speed the onboard pre-processed data is taken through a fast-track sequence e.g. radon demultiple, 3D DMO stack and the data migrated onshore and loaded to a workstation. This would typically take 4 weeks from the end of survey. In practise the interpreter prefers to wait for the final volume since otherwise the interpretation is done twice. If the 3D is just being shot to confirm a well location which is already pretty firm then onboard processing may be a viable route. Note the data may have to be re-processed.
The contractor should ensure that someone senior onboard is responsible for the processing. It is important for the oil company representatives (including interpreter) to attend the mobilisation meeting (maybe even ride the boat for a few weeks) to make sure the targets are defined and that everyone knows who everyone is. As ever with contractors you are in the hands of the people doing the job. Western Geophysical have a system where the data is processed onboard remotely by a team based onshore. This hybrid method may be quite attractive to some.
Most vessels can now ship off example sections or screendumps by email for decision making back at base (either contractor/oil company or both) and staff should be encouraged to do this if there is time. The ideal processing situation is to shoot the first line and then go down for weather/technical downtime for a week !! Velocity files can also be easily compressed and shipped if these are being picked onboard. For this reason it may not be required to put a full-time QC onboard. The onboard seismic rep should in any case be pretty knowledgeable about processing.
The contractors will often try and cut corners. For instance GECO used to process everything at 16 bit onboard and stored intermediate data in their format on exabyte cartridge. The contract should specify that a SEGY prestack archive (e.g. after RADON demultiple) should be produced onboard on 3590 cartridges. This gives a good starting point when the re-processing inevitably has to take place. Contractors will also try and cheat on the number of parabolas used for RADON demultiple, often limiting to the fold or less. The fold + 20% (or some other number) should be specified in the contract.
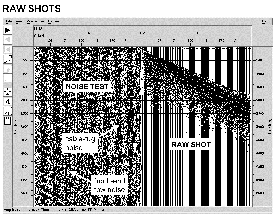
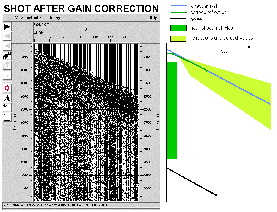
The shot records in the previous figures are used to identify principal reflections of interest, including various sources of noise. Click here to obtain an enlarged display of a raw shot record and here to display the shot after t2 gain correction with events identified. When data is recorded raw noise files are usually acquired at the beginning and end of line. A noise file is created by recording a shot but not firing the source. The noise file in the previous figures clearly shows noise generated by tug at the front end and far (from tailbuoy) end of the streamer. This low frequency noise would typically be removed by a combination of bandpass filtering and DMO. Noise files should be removed (by editing) before processing. Field data are also acquired with several auxiliary traces which would be removed (by editing) prior to processing. The near channel is usually numbered 240 but in this instance is numbered 1. In the figure the direct arrival does not arrive at time zero because there is a recording delay built into the system which should be removed before processing begins. Observers logs should detail channel numbers, noise files, auxiliary traces and start of data delays. The second figure identifies several events on the gain corrected shot. Yilmaz contains forty shot records from around the world and indicates data and noise types.